Decoding Travel Times: Analyzing Trip Discrepancies
Analyzing Trip Time Discrepancies: Insights and Challenges
The Translational Data Analytics Institute capstone project at Ohio State University focused on analyzing and predicting discrepancies between real-life trip times and those projected by the Google Distance Matrix. This project aimed to understand how various factors such as geography, time of day, and weather influence travel time accuracy. By examining these discrepancies, the team sought to uncover the limitations of current predictive models and explore ways to improve the accuracy of travel time predictions.
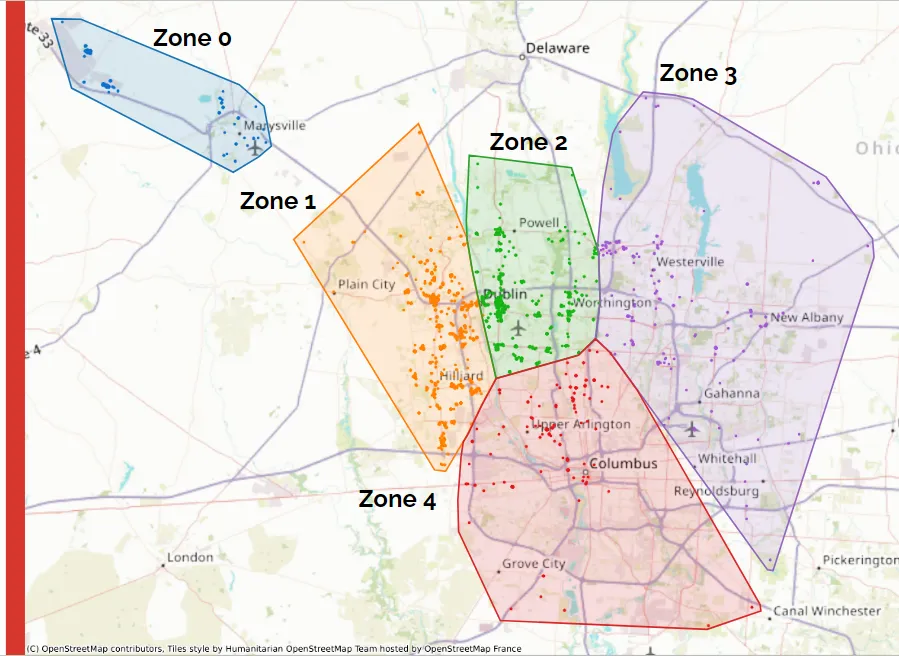
The project began with a comprehensive data collection phase, utilizing data from the Google Distance Matrix API, weather APIs, and geospatial data sources. The team analyzed trip data from various geographic zones in Columbus, Ohio, filtering the data to identify patterns and trends. Initial findings revealed that predictions based solely on straightforward geographical coordinates faced significant accuracy challenges. This highlighted the need to consider additional dynamic factors that could impact travel times.
In the analysis phase, the team employed various machine learning techniques to build predictive models. Despite rigorous data analysis efforts, the models struggled to account for real-world complexities such as route choices, traffic conditions, and unexpected delays. This phase underscored the challenges of modeling real-world travel dynamics using traditional data sets and analytical approaches. The team found that even sophisticated models had limitations in predicting travel times accurately under varying conditions.
Visualization played a crucial role in this project, helping to illustrate the relationships between trip timeliness and influencing factors. The team created maps to display traffic patterns and geographic zones, bar charts to highlight non-traditional peak hours, and flowcharts to classify trips based on their duration deltas. These visualizations provided valuable insights into how factors like time of day and weather conditions influenced travel times, challenging common assumptions about rush hour patterns and peak traffic periods.
The project concluded with several key insights and recommendations for future research. The experience highlighted the complexity of accurately predicting travel times and the need for more dynamic and adaptable models. The team suggested incorporating real-time traffic data and exploring alternative data sources to enhance model accuracy. Overall, the project underscored the importance of understanding the limitations of current predictive models and the potential for more sophisticated approaches to improve travel time predictions in real-world scenarios.
Stay Connected
Follow our journey on Medium and LinkedIn.